
In the dynamic landscape of Kubernetes network security, it is necessary to be cautious. Tetragon is an eBPF-based Security Observability and Runtime Enforcement tool that integrates with Parseable, a lightweight, high-performance log analytics tool. This post walks you through how to extract and analyse network connections effectively in Parseable using Tetragon. We'll explore how to trigger an alert in the event of outbound connections occurring from the running pod.
After establishing our production environment, we expect that the application won’t need to download additional files. If the pod executes commands like curl or wget, Parseable will generate an alert message.
Pre-requisites
To get started, you'll need the following prerequisites:
- A Kubernetes cluster with admin access.
- kubectl is installed on your local machine.
What is Network Observability?
eBPF adds security and observability features without modifying the inner workings of Linux or even restarting the system. With eBPF, special programs can run securely inside Linux kernel while it's running, giving us more access over what is happening inside the kernel. eBPF makes it easy to keep an eye on what's happening in the system, like who's accessing the network or files, without affecting the actual programs we're running.
Tetragon is an eBPF-based observability and security enforcement tool. Network Observability is one of the use cases of Tetragon Observability. It provides real-time visibility into network operations. TracingPolicies are applied to filter a particular kind of event.
For example,
- tcp-connect.yaml TracingPolicy will filter TCP connect events.
- sshd.yaml TracingPolicy is used to monitor remote connections.
- egress.yaml TracingPolicy will monitor all cluster egress connections.
In this post, we’ll see a demo to audit external connections from a Kubernetes cluster and get valuable insights to protect our cluster. We will apply the egress.yaml policy and get an alert when the pod executes commands like wget or curl.
Implementation of Network Observability in Parseable through Tetragon and Vector
How to implement Network observability in Parseable?
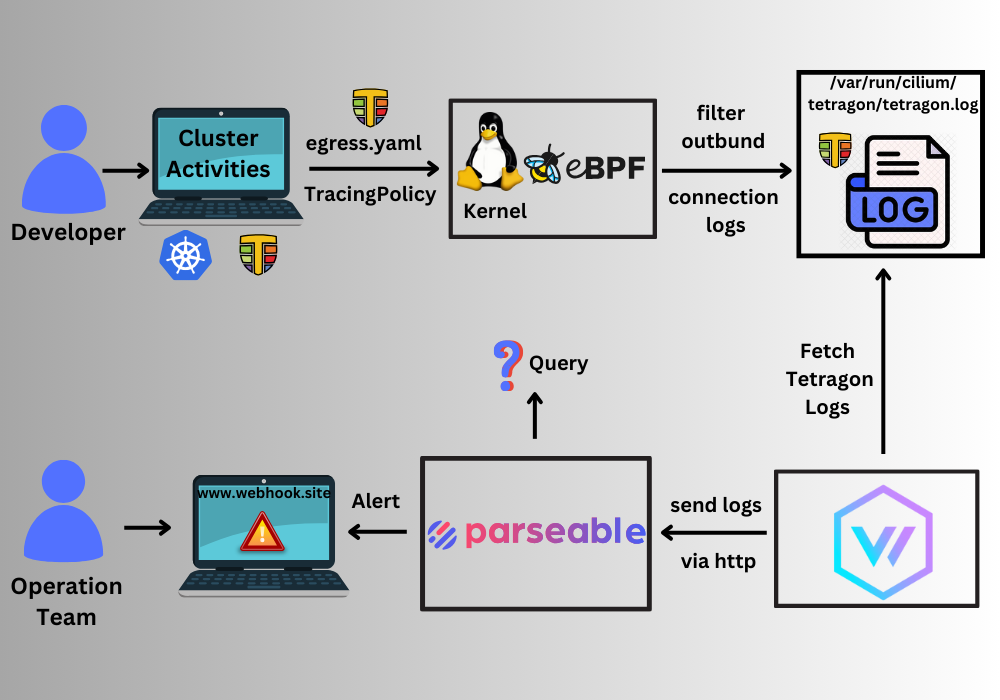
We will execute the steps depicted in the diagram provided below.
- Tetragon is attached to the Kubernetes cluster to enable kernel-level log observability with eBPF.
- Apply ingress.yaml TracingPolicy to extract external connections.
- Tetragon Log stores in /var/run/cilium/tetragon.log file.
- Fetch the logs through a vector agent and send them to the Parseable server.
- We can view the logs in the Parseable console and generate an alert.
Let’s install required tools to implement Network observability.
Parseable and Tetragon Installation
- To install Tetragon and Parseable in your Kubernetes cluster, Follow the steps from the previous post – eBPF Log Analytics in your Kubernetes clusters.
- In Parseable Installation, change the service type to NodePort to expose Parseable UI externally.
kubectl patch -n parseable svc parseable -p '{"spec": {"ports": [{"port": 80,"targetPort": 8000,"protocol": "TCP","nodePort": 30000}],"type": "NodePort","selector": {"app.kubernetes.io/name": "parseable"}}}'
- List the services running in a parseable namespace
kubectl get svc -n parseable
Open the URL http://worker-node-ip:30000 and login with admin Username and Password.
- Verify the Tetragon installation.
kubectl get pods -A
If Parseable and Tetragon Pods are running then proceed further.
Track Network Commands Execution with Parseable
- Create a pod: We’ll create a demo pod like we create in a production environment.
kubectl run nginx-pod --image=nginx
Next, we will apply a TracingPolicy to extract external connections.
Apply TracingPolicy
- Obtain egress.yaml TracingPolicy.
wget https://raw.githubusercontent.com/cilium/tetragon/main/examples/policylibrary/egress.yaml
- Create a TracingPolicy to extract external connections,
kubectl apply -f egress.yaml
Next, verify the events generated in the pod.
Execute wget/curl Commands from the Pods
To generate the events, let’s run the following commands in the pod.
- Exec into nginx-pod and apply wget command with any link,
kubectl exec -it nginx-pod -- wget https://www.parseable.com
- Exec into nginx-pod and apply the curl command with any link,
kubectl exec -it nginx-pod -- curl https://www.parseable.com
Let’s go to the Parseable UI and check the logs.
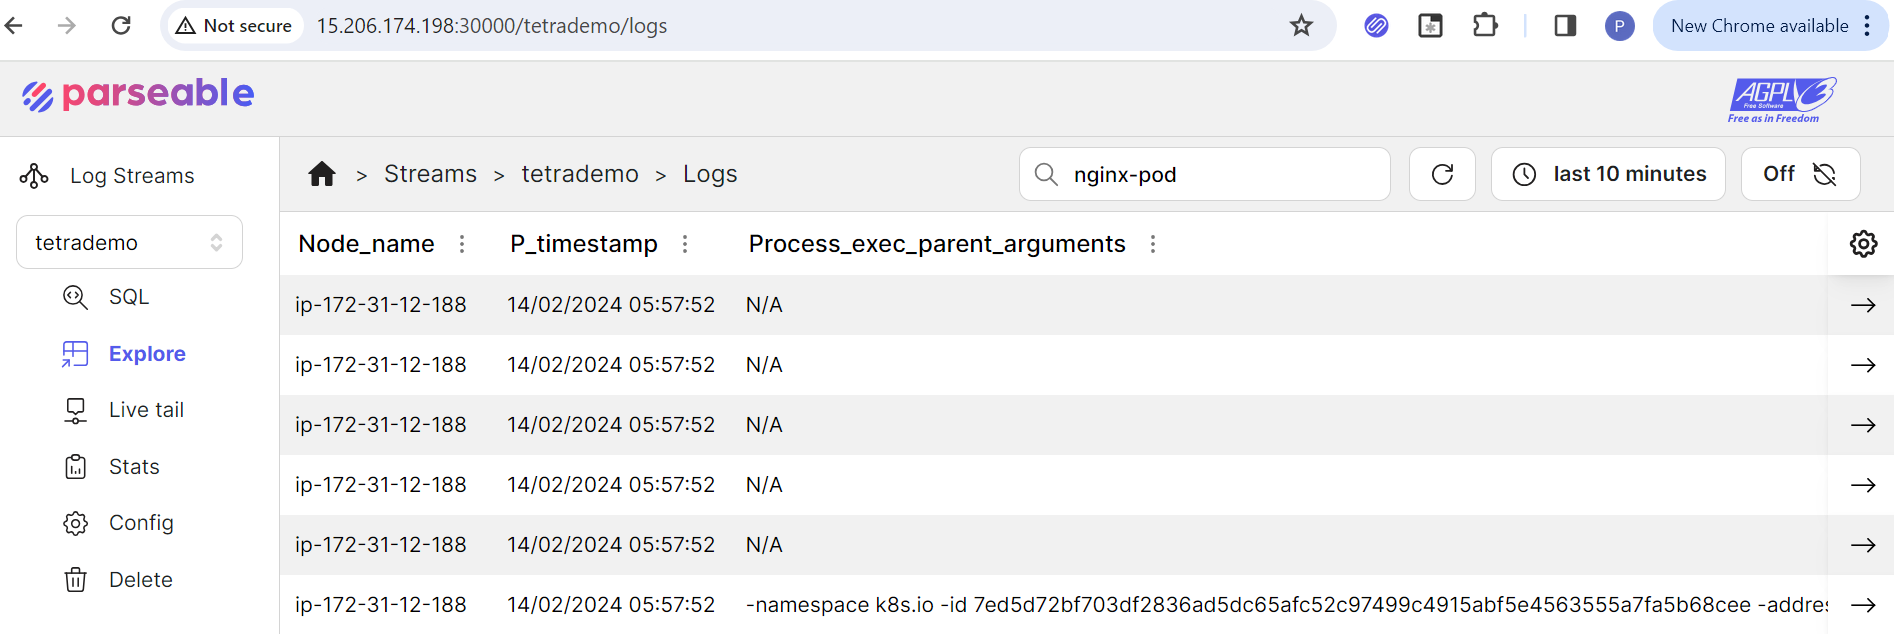
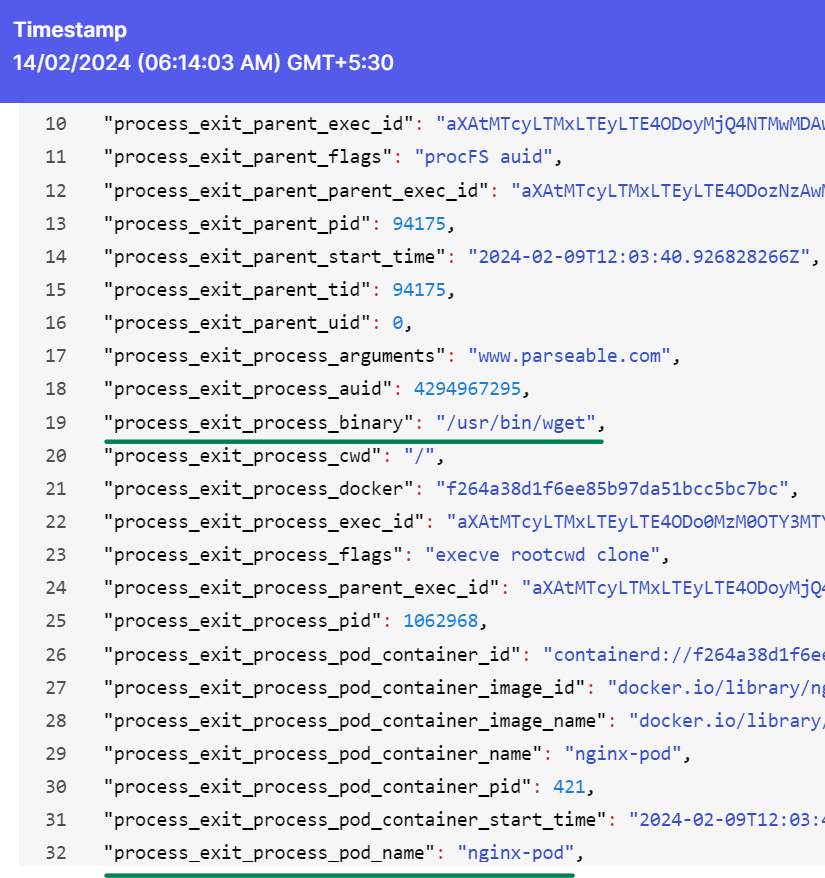
Click on a raw to see the logs in JSON format. Next, We will generate an alert.
Set an Alert in Parseable
- Click Parseable
console->config->alert
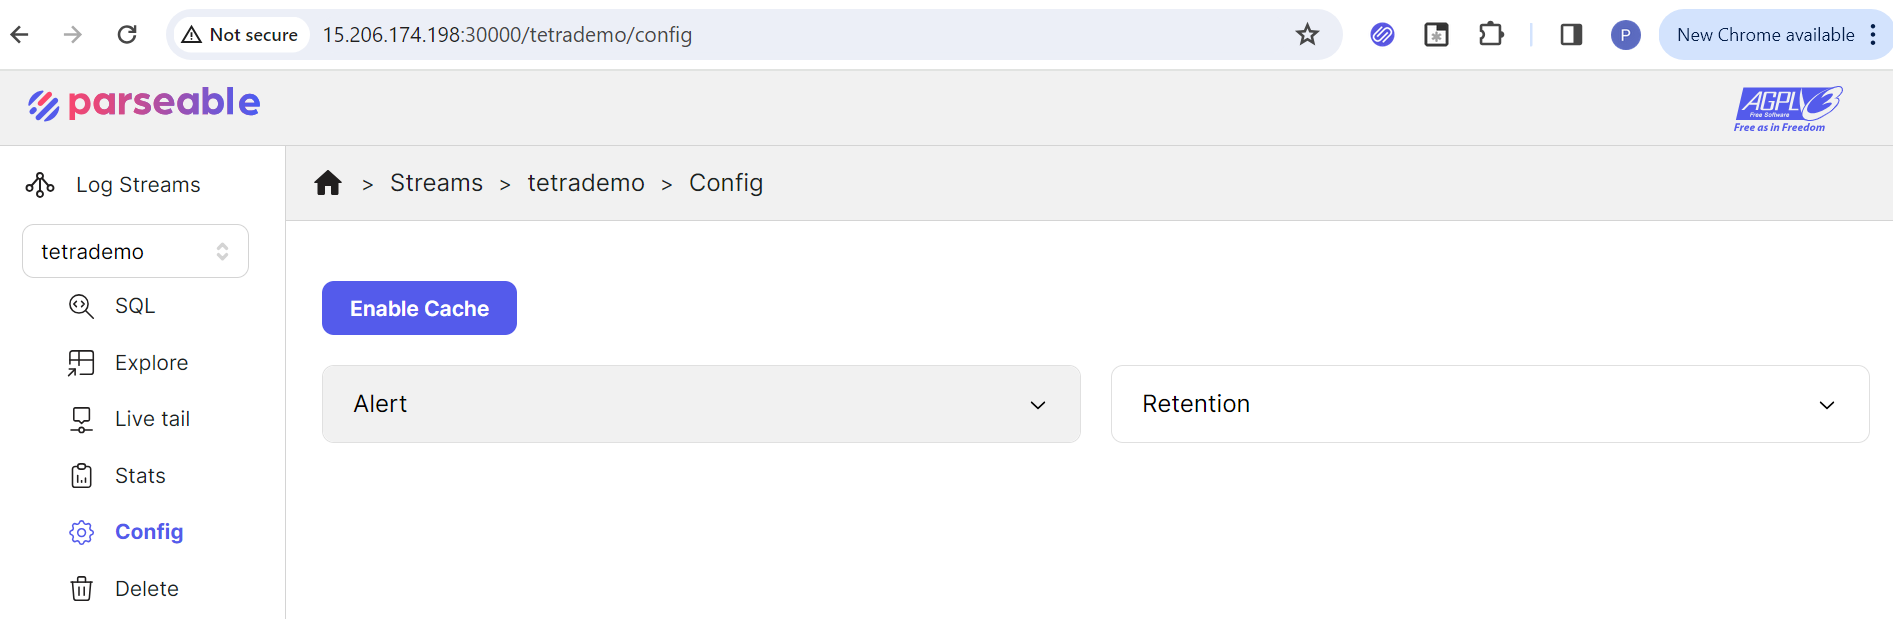
- Use the following JSON code to set an alert from the Parseable UI.
{
  "version": "v1",
  "alerts": [
    {
      "targets": [
        {
          "type": "webhook",
          "endpoint": "webhook.site_custom_endpoint",
          "headers": {},
          "skip_tls_check": false,
          "repeat": {
            "interval": "10s",
            "times": 5
          }
        }
      ],
      "name": "wget_command",
      "message": "wget command was executed from the pod : {process_exit_process_pod_name}",
      "rule": {
        "type": "composite",
        "config": "(process_exit_process_binary =% \"/usr/bin/wget\")"
      }
    },
    {
      "targets": [
        {
          "type": "webhook",
          "endpoint": "webhook.site_custom_endpoint",
          "headers": {},
          "skip_tls_check": false,
          "repeat": {
            "interval": "10s",
            "times": 5
          }
        }
      ],
      "name": "curl_command",
      "message": "curl command was executed from the pod : {process_exit_process_pod_name}",
      "rule": {
        "type": "composite",
        "config": "(process_exit_process_binary =% \"/usr/bin/curl\")"
      }
    }
  ]
}
This alert will trigger when we execute curl from the pod. Set up the target endpoint on https://webhook.site and copying your unique URL. Paste it in place of webhook.site_custom_endpoint. Click the Submit button.
Now, let's verify how the above Parseable setup triggers an alert.
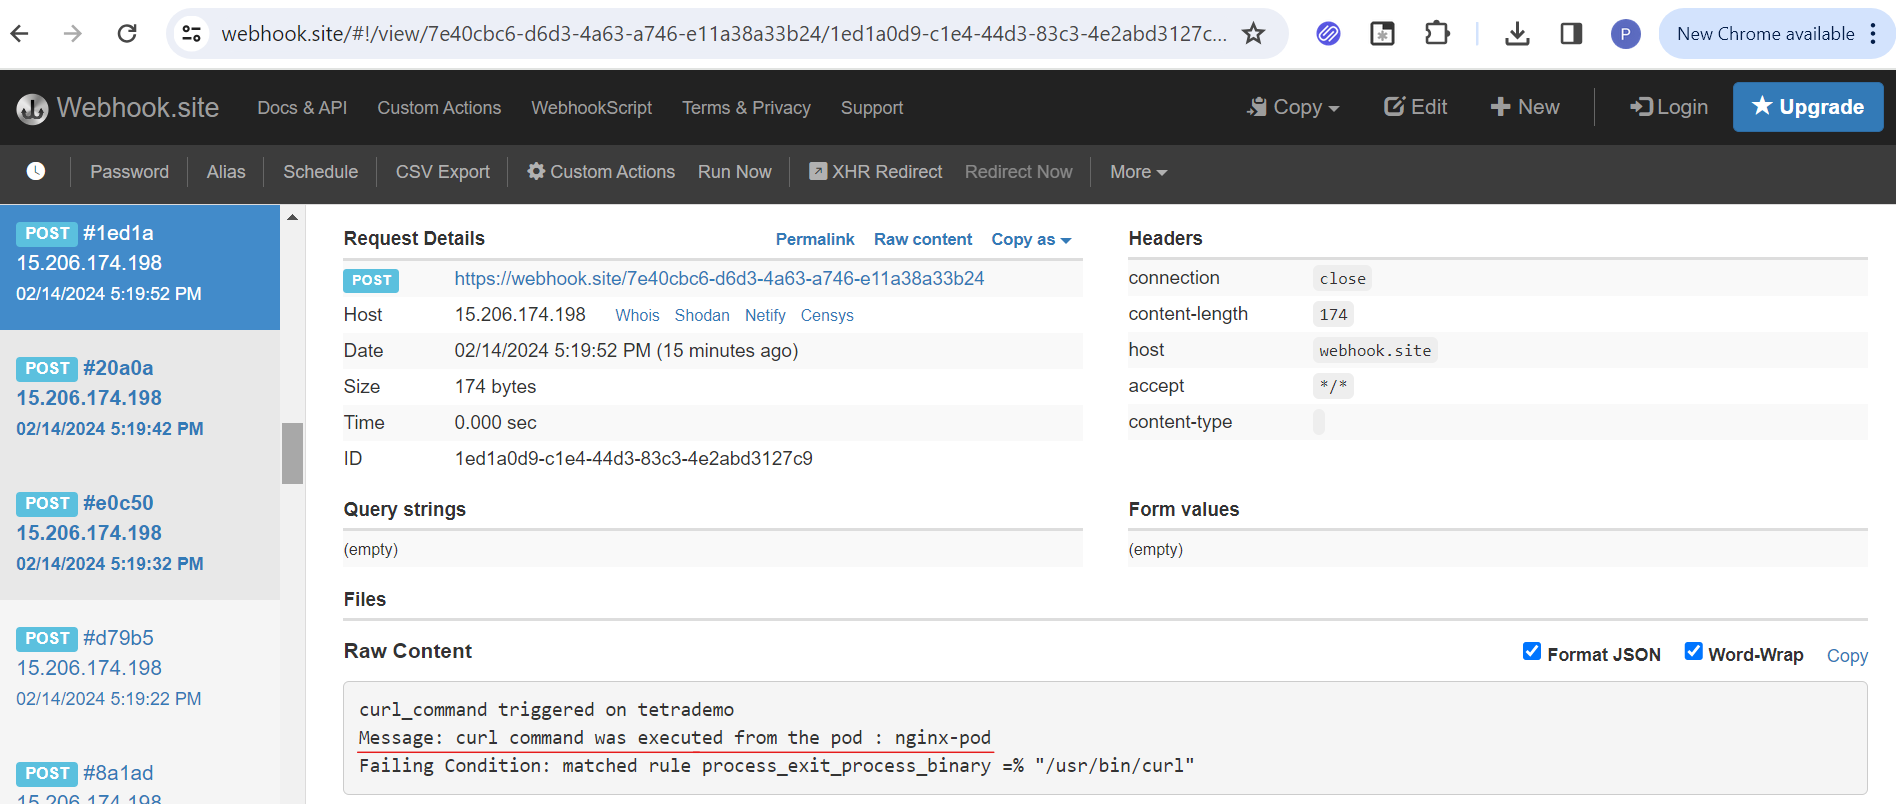
- exec into the nginx-pod and apply the curl command and check the unique URL to see the alerts.
kubectl exec -it nginx-pod -- curl https://www.parseable.com
Open the unique URL again in a new tab for getting alert messages.
exec into the nginx-pod and apply the wget command and check the unique URL to see the alerts.
kubectl exec -it nginx-pod -- wget https://www.parseable.com
Open the Unique URL again and see the message below.
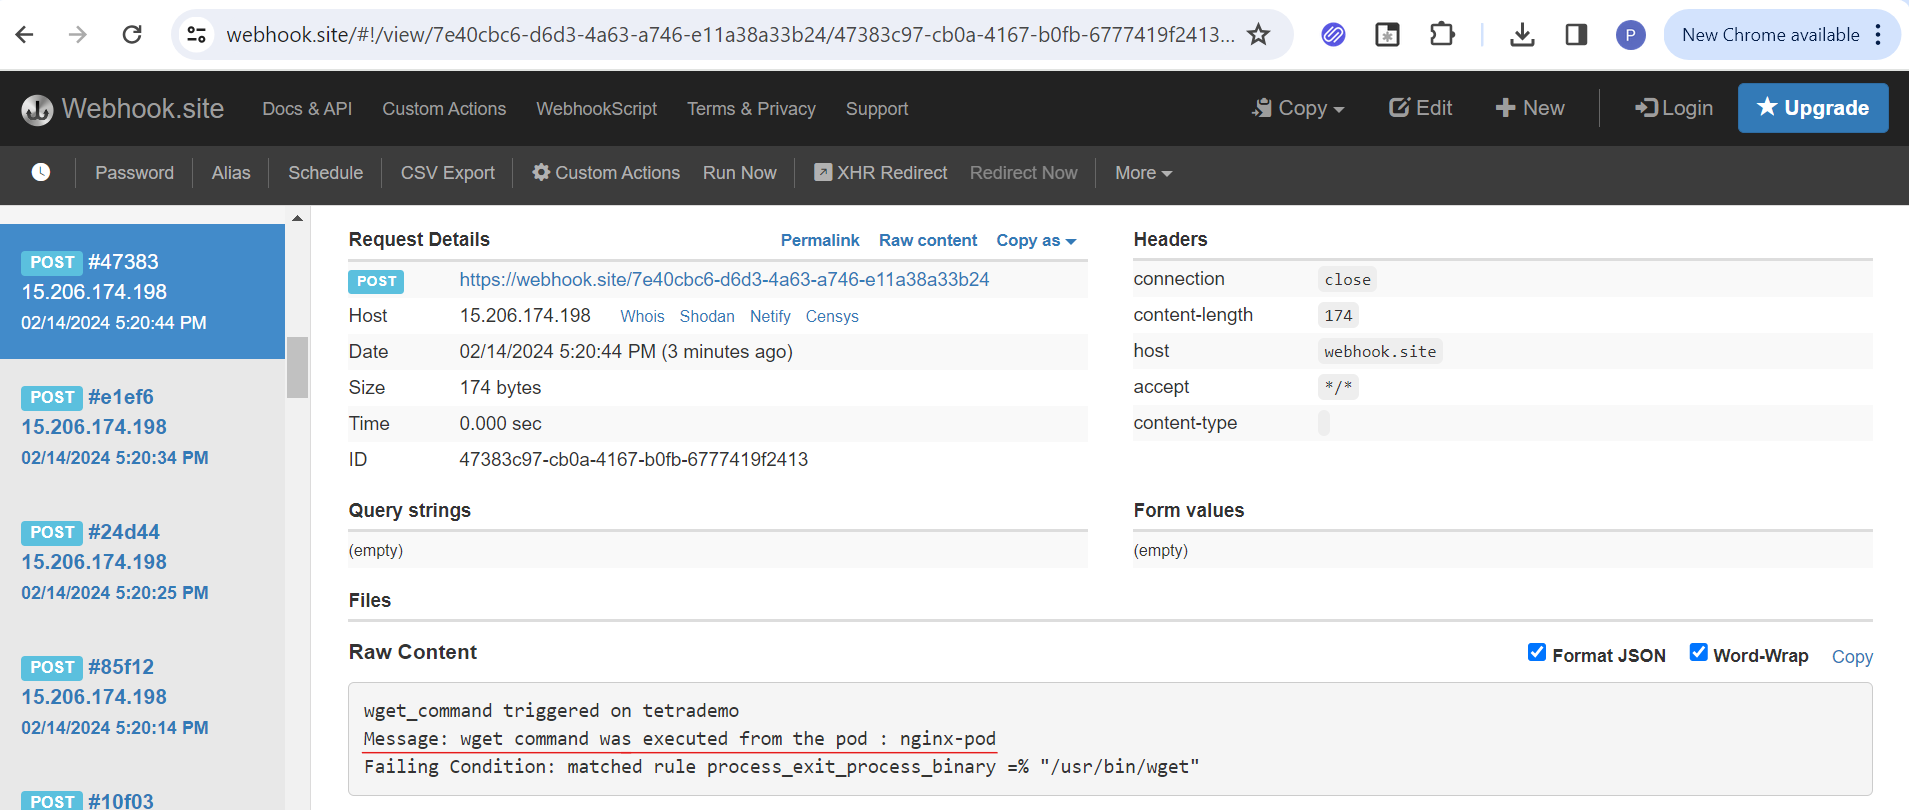
You can see the message "wget_command/curl_command" triggered in tetrademo as shown in the screenshot above. This is how the cluster admin can identify outbound connections in the cluster and address them promptly.
Conclusion
In this post, we have seen How Parseable and Tetragon work with the Kubernetes environment. We set up a logging pipeline with vector and Parseable, attached Tetragon and generated an alert in Parseable for the outbound connections.
References
[1] https://www.parseable.com/ [2] https://tetragon.io/ [3] https://vector.dev/ [4] https://www.parseable.com/blog/vector/vector-tetragon-values.yaml (Used to install vector agent) [5] https://github.com/cilium/tetragon/blob/main/examples/quickstart/network_egress_cluster.yaml (Tracing Policy : egress.yaml)