

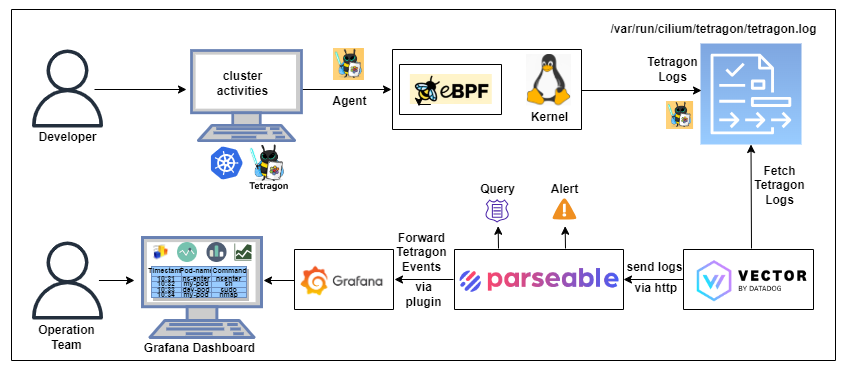
In our previous post Get started with eBPF log analytics in your Kubernetes cluster, we saw how to ingest Tetragon logs in Parsable and generate alerts when a sensitive file like /etc/passwd is accessed by an unauthorized pod. However, it is time-consuming and generally difficult to work with large volume of raw logs. Visualizing logs in a dashboard helps better identify patterns.
This post is a continuation of the previous post. In this post, we will see how to visualize the eBPF logs in Grafana.
Specifically, we'll take a look at the following use cases and see to visualize them in Grafana:
- When multiple sensitive files are accessed through different pods.
- When unexpected binary executables run from the pods.
Pre-requisites
To get started, you'll need the following pre-requisites:
- A Kubernetes cluster with admin access. If you don't have one ready, you can create it using Minikube or Kind.
- kubectl installed on your local machine.
- Follow the steps in the previous post to install Tetragon and Parseable in your Kubernetes cluster.
What is Grafana?
Grafana is an open-source Query, visualize, alerting system. It helps you understand your data no matter where it’s stored. With Grafana you can create, explore, and share all of your data through beautiful, flexible dashboards. In this post, we'll use Grafana to track and visualize eBPF logs.
Get started
In this blog, we assume that you already have Tetragon, Vector and Parseable installed in your Kubernetes cluster. If not, please follow the steps in the previous post to install them.
Install Grafana
First of all, we need to install Grafana in our Kubernetes cluster. We'll use the official Grafana Helm chart. Refer the official documentation for more details.
helm repo add grafana https://grafana.github.io/helm-charts
helm install grafana grafana/grafana --namespace grafana --create-namespace
Then we need to expose the Grafana service to the outside world. We'll use the NodePort type for this.
kubectl patch -n grafana svc grafana -p '{"spec": {"ports": [{"port": 80,"targetPort": 3000,"protocol": "TCP","nodePort": 31000}],"type": "NodePort","selector": {"app.kubernetes.io/name": "grafana"}}}'
Wait for some time for the grafana pod to get started and verify the pod is running in a grafana namespace.
kubectl get pods -n grafana
Next, use the below command to get the password for the admin Grafana user.
kubectl get secret --namespace grafana grafana -o jsonpath="{.data.admin-password}" | base64 --decode ; echo
Next, we'll install the Parseable datasource plugin in Grafana. This plugin is used to query the Parseable and visualize the data in Grafana.
Install Parseable datasource plugin
Please refer to Grafana data source integration guide to install the Parseable plugin in Grafana.
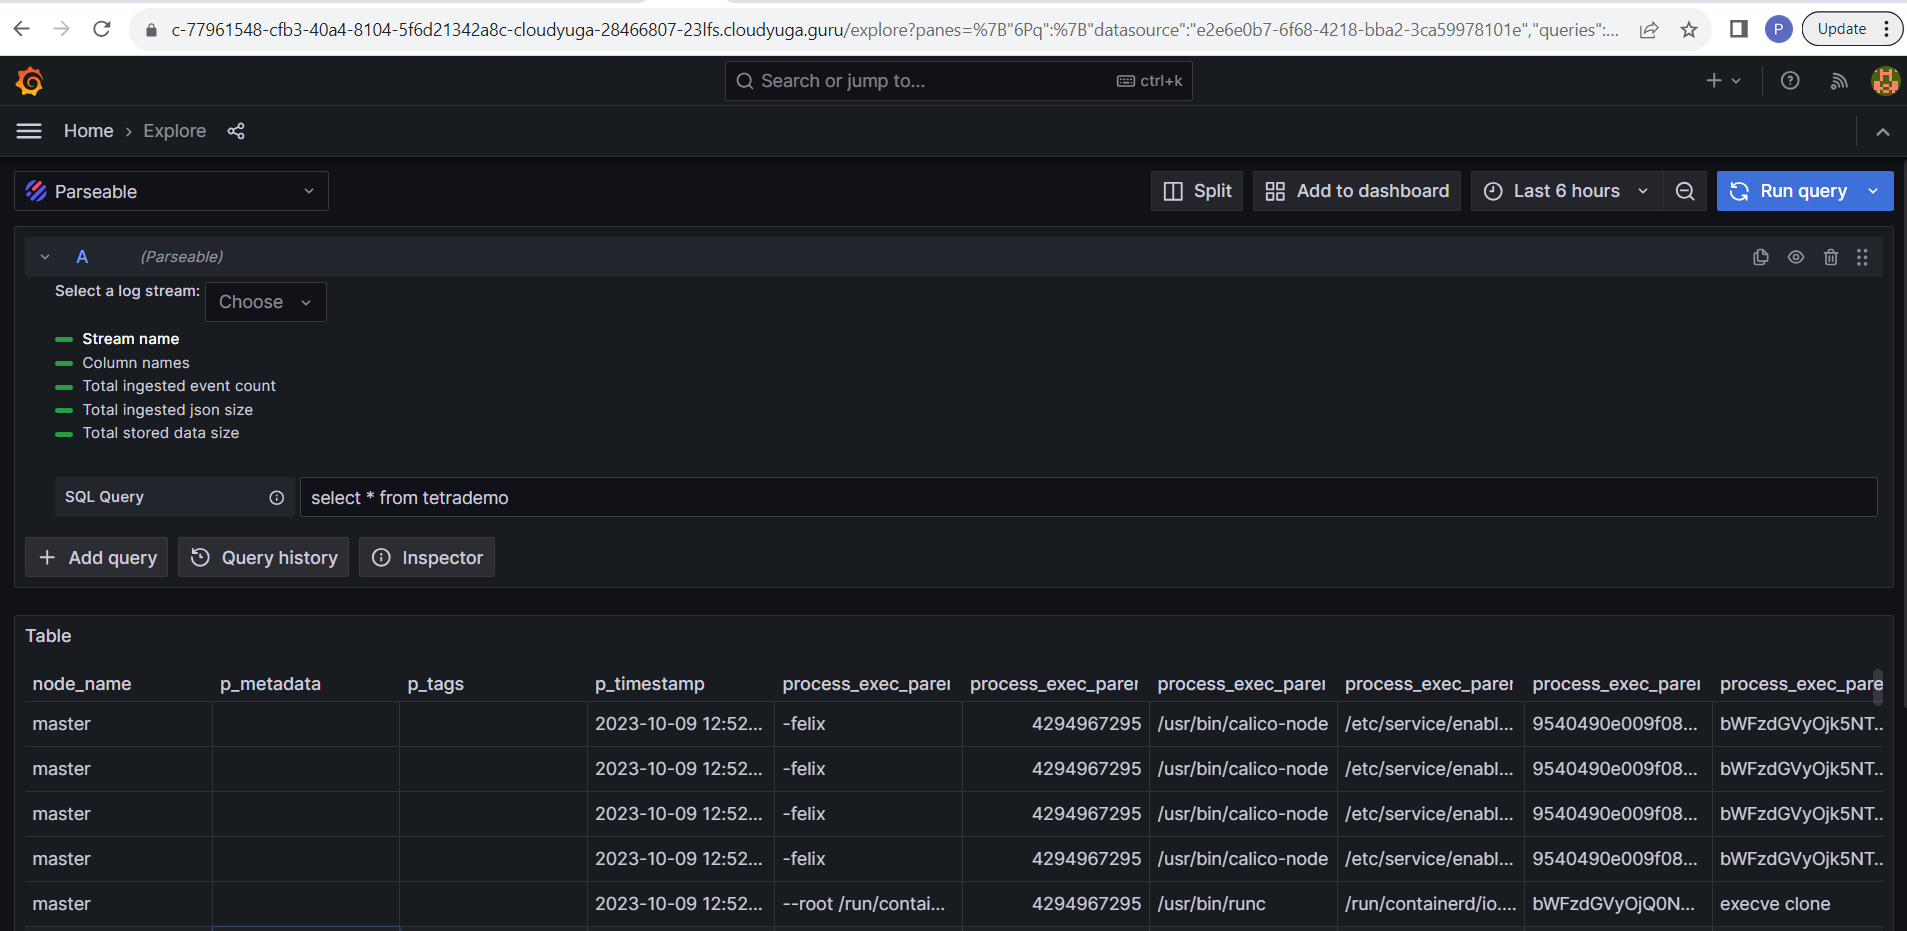
- Select
Data sources>>parseable>>explore - Select
logstream. In this case, we'll use the already existing log streamtetrademo, that has the Tetragon / eBPF logs ingested.
Execute the below SQL query by clicking on the Run Query button.
select * from tetrademo ;
Import Grafana dashboard
We have already created a Grafana dashboard that can be imported to visualize the eBPF logs. Follow the below steps to import the dashboard.
- Download the Grafana-Dashboard.json file.
- Click on
Menu>>Dashboards>>New>>Import. - Click the Load button and select the json file downloaded in the previous step. Click Import Dashboard.
- Select Parseable data source.
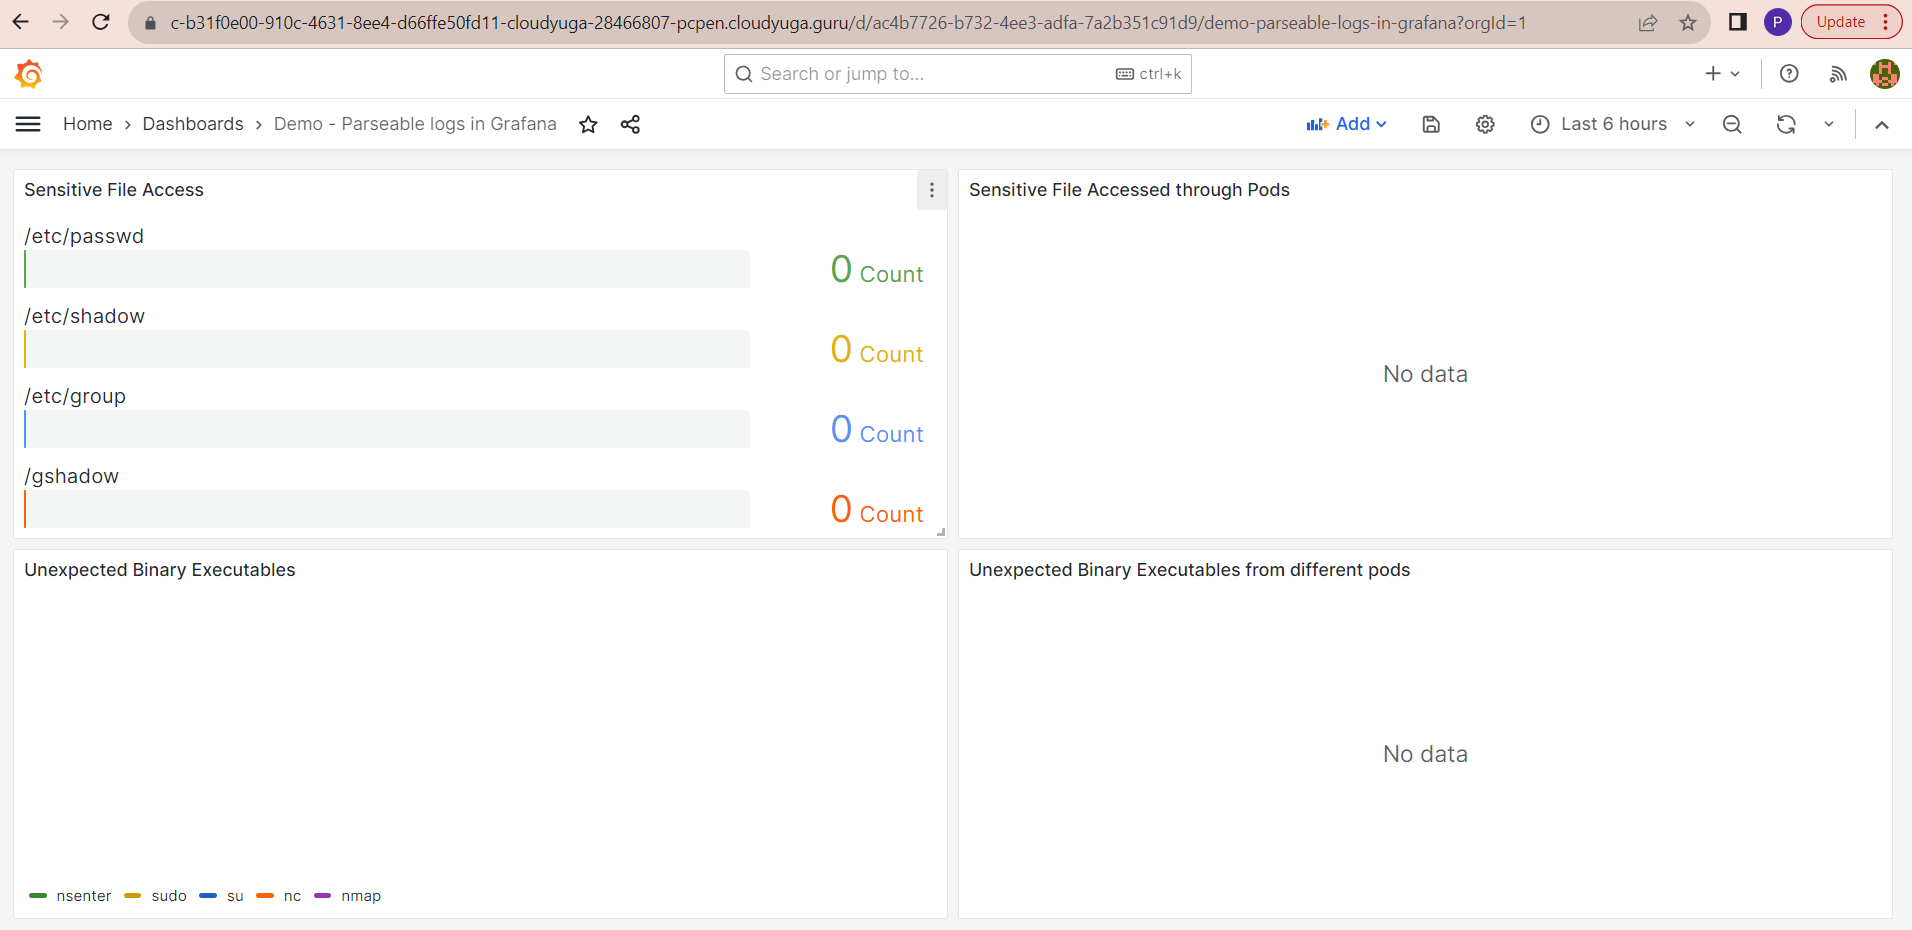
You will see a graph with no data. The default theme is dark. You can change the theme from the Menu >> Administration >> Default Preferences >> Interface Theme >> Light.
Use case: Spot sensitive files access
- Create a pod with privileged access.
kubectl apply -f https://www.parseable.com/blog/tetragon/dev-pod.yaml
- Create another Nginx pod.
kubectl run nginx-pod --image=nginx
Check if the pods are running.
kubectl get pods
- Apply TracingPolicy for read/write access.
kubectl apply -f https://www.parseable.com/blog/tetragon/tracing-policy.yaml
It will now monitor sensitive files like /etc/passwd, /etc/shadow, /etc/group, /etc/gshadow.
- Access the sensitive file from the privileged pod.
Now, exec into the dev-pod, nginx-pod and apply the cat command to read the following files,
kubectl exec -it dev-pod -n default -- cat /etc/passwd
kubectl exec -it dev-pod -n default -- cat /etc/shadow
kubectl exec -it dev-pod -n default -- cat /etc/group
kubectl exec -it dev-pod -n default -- cat /etc/gshadow
kubectl exec -it nginx-pod -n default -- cat /etc/gshadow
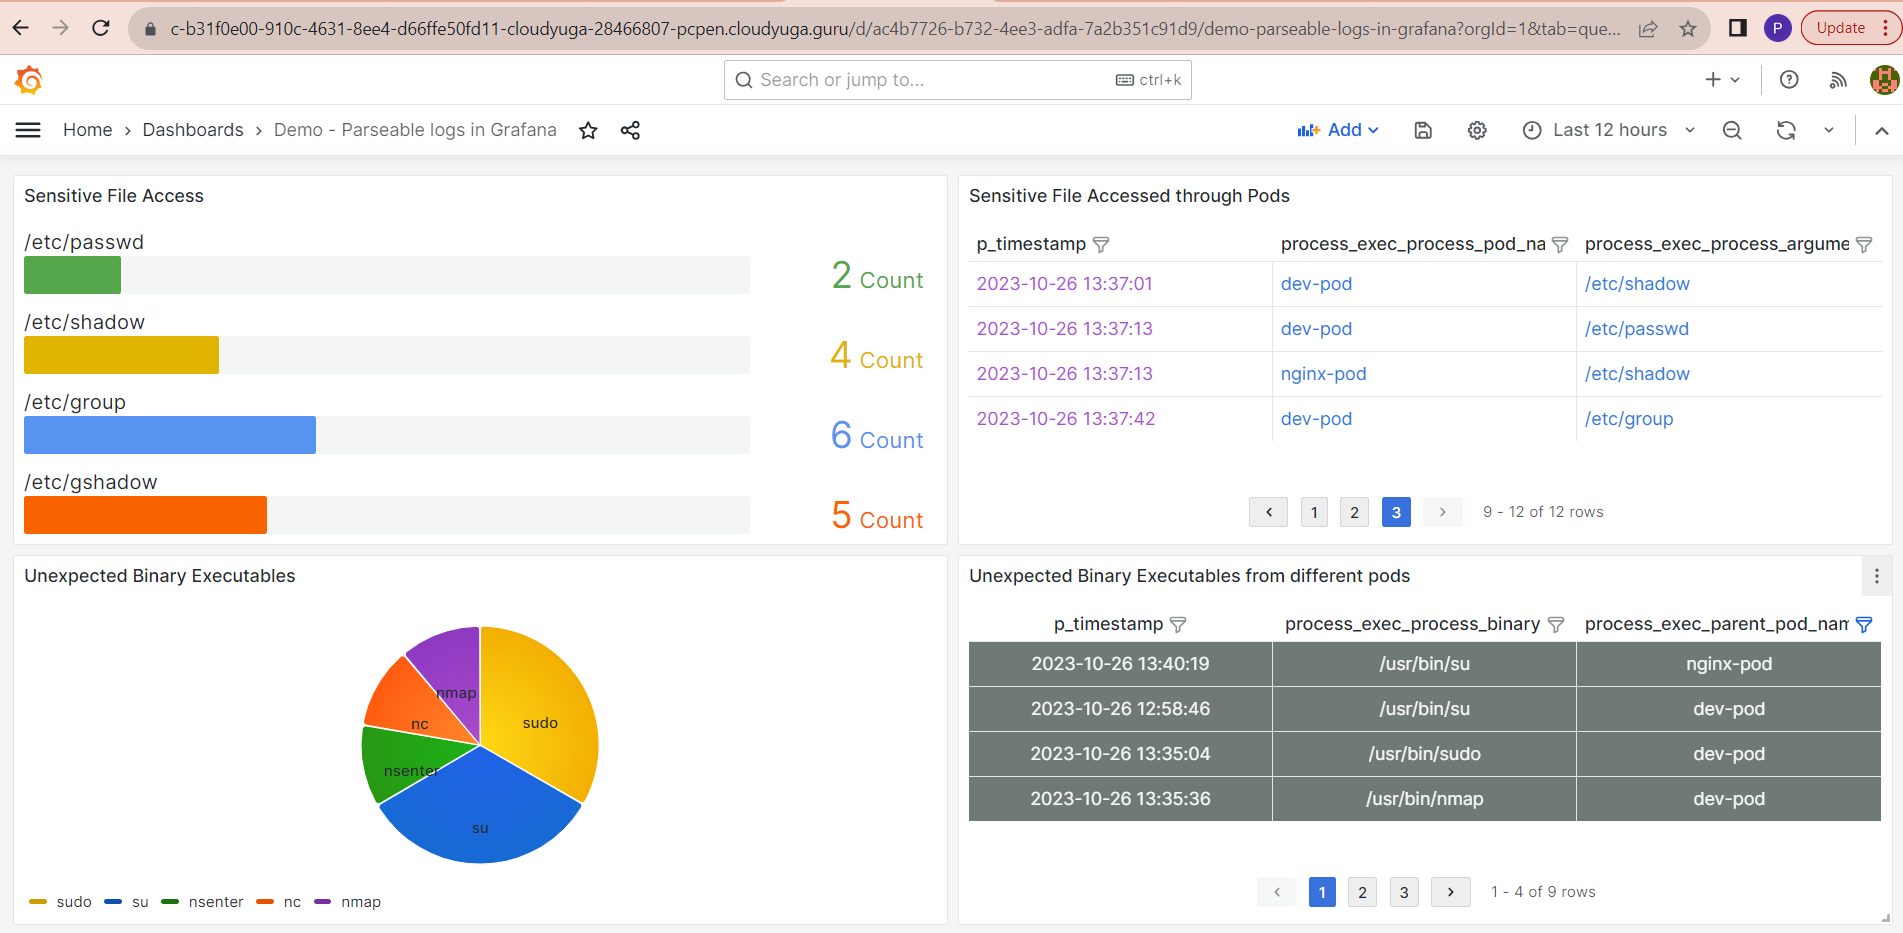
- Grafana dashboard
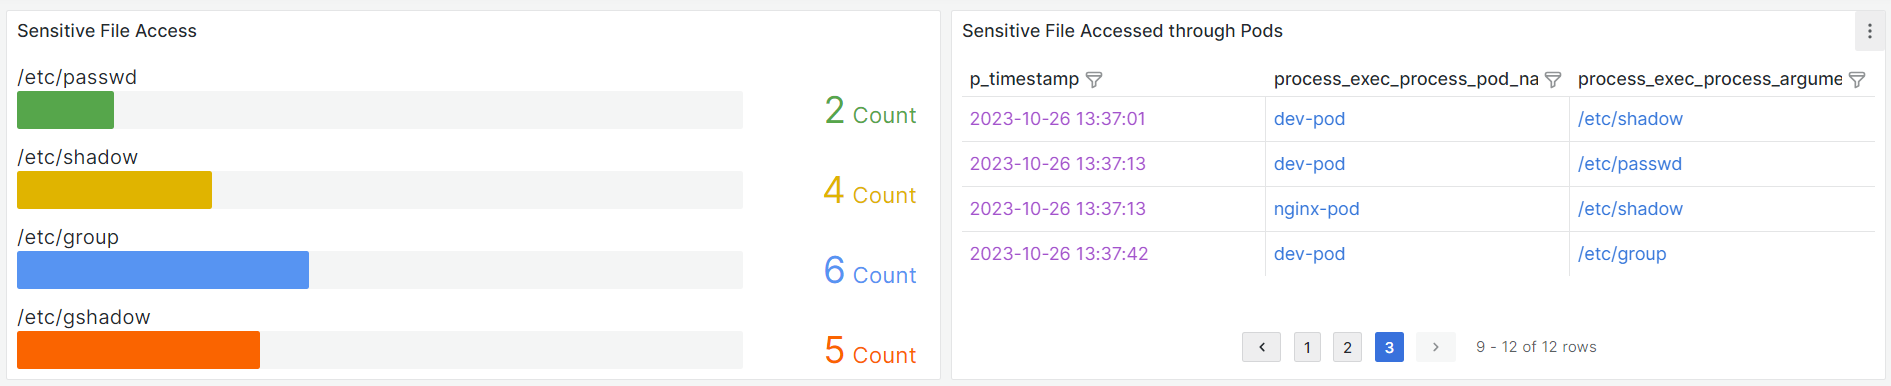
Open the Grafana Dashboard to see the horizontal bar gauge graph for sensitive file access count. A table shows us which pod accessed which file. We can filter data for specific timestamps, pods, or files.
- Cleanup
Remove the tracing policy.
kubectl delete -f https://www.parseable.com/blog/tetragon/tracing-policy.yaml
Use case: Spot unexpected binary executables
In this use case, we'll see how to spot unexpected binary executables run from the pods. We'll use the same Grafana dashboard to visualize the data. We'll use the same dev-pod to execute the binaries.
- Exec into the
dev-pod.
kubectl exec -it dev-pod -- sh
- Execute the following commands in the
dev-pod.
sudo ls -l
ls -l
nc --help
sudo apt install nmap nmap --help
useradd dev
su dev
nsenter
Note that all of these are administrative commands that are not expected to be run from a pod.
nsenter : Run the program in different namespaces
su : switch user
sudo : superuser do
nc : netcat, allows users to read & write data over the network connection, establish a connection, send and receive data, etc.
nmap : network mapper which provides real-time details of a network. It may include IPs activated on the network, ports open in a network, live hosts, Port, OS and Host scanning, etc.
Exec into the Nginx pod.
kubectl exec -it nginx-pod -- sh
- Execute the following commands in the
nginx-pod.
sudo ls -l
nc --help
sudo ls -l
nc --help
- Grafana dashboard
Open the Grafana Dashboard from the Grafana URL. We prepared a pie chart to show the command executed from the pods. The table shows which pod executes which binary.
Conclusion
In this post, we covered how Parseable fits into the Kubernetes ecosystem with Tetragon logs. We set up a Tetragon logging pipeline with Vector and Parseable, applied TracingPolicy, and generated alerts in Parseable when sensitive files were accessed.
Do you have further ideas or feedback you'd like to share? Join our Slack channel to start a conversation! We value your insights and look forward to hearing your thoughts and suggestions.
In our upcoming post, we can add better visualization using Grafana to display sensitive file access. We'll use the Parseable plugin for Grafana to achieve this.